
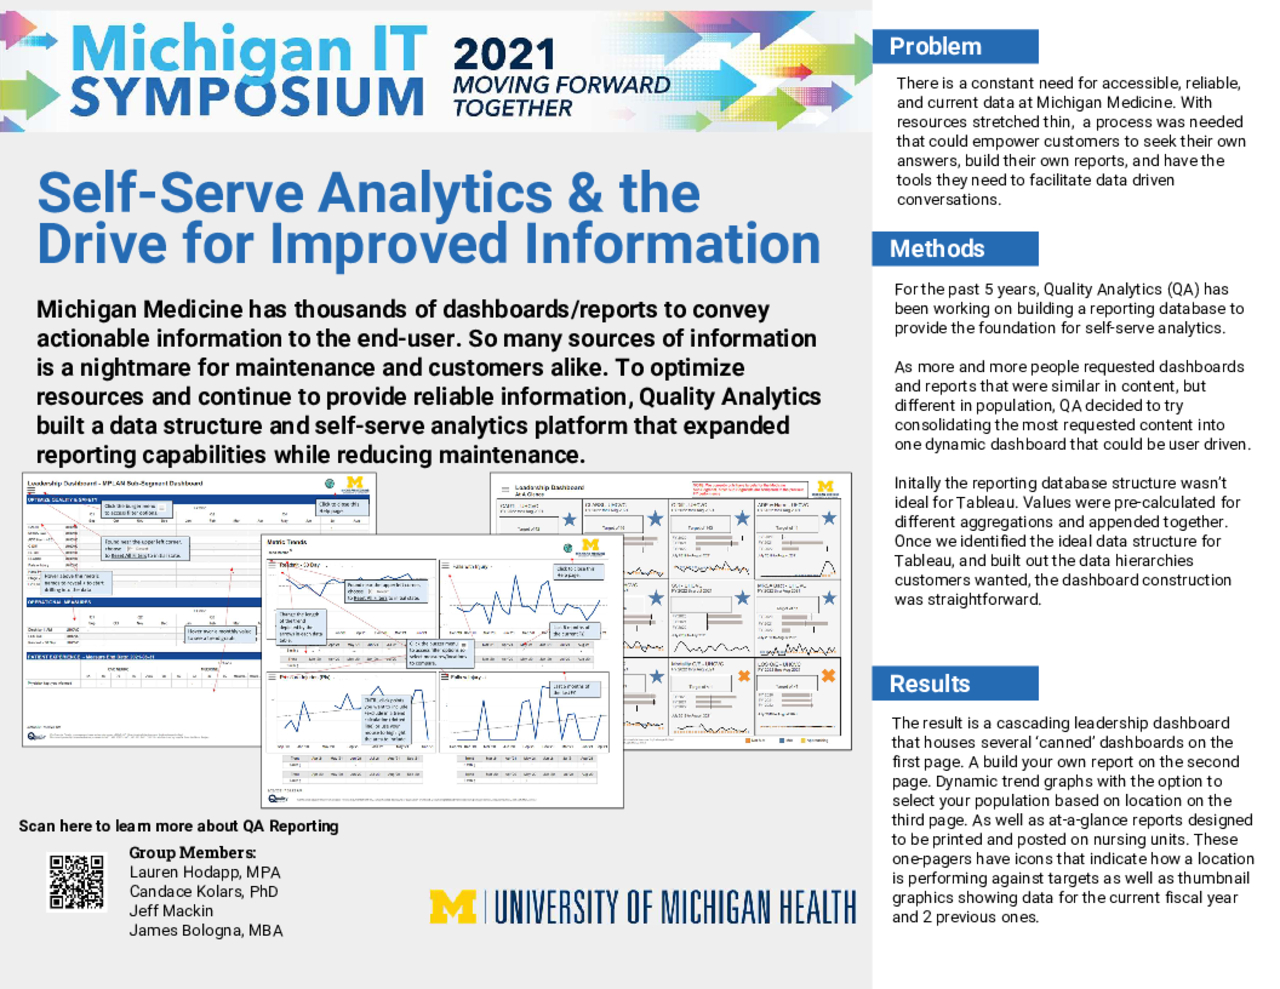
Abstract
Michigan Medicine has thousands of dashboards/reports each trying to convey useful, often actionable, information to the end-user. However, a one-stop dashboard that provides not only clinical outcomes, but also processes, HR, and financial data, did not exist. With so many sources of information, ensuring consistency, avoiding redundancy, and keeping up with maintenance became a nightmare. To optimize resources and continue to provide reliable information, Quality Analytics built a data structure and self-serve analytics platform that has expanded reporting capabilities while reducing maintenance.
Building upon an existing reporting framework in Oracle, we used Tableau to develop a user-friendly dashboard that allows the customer to either select a "canned"report or build their own by selecting from an extensive list of metrics. The dashboard also offers dynamic trend graphs to facilitate discussions in meetings, at-a-glance thumbnails for posting on patient units, and control charts to bring attention to potential problem areas. The entire program was built from a common data library that allows departments to submit and use measures. Combined with a "unified reporting" website, users receive reports with information they know is accurate.